Its time to Buy AUDUSD
- April 4, 2023
- Posted by: Noureldeen Al Hammoury
- Categories:
Its time to buy AUDUSD. The Reserve Bank of Australia decided to keep the current rate unchanged, while it showed a well-balanced statement. Not too hawkish and not too dovish at the same time, while the Aussie declined by 25pips so far.
We issued a new long position ahead of the decision at 0.6780. This is the initial trade only, we will add more longs in the coming hours, as the current downside retracement will be limited, and its likely to end before the end of this week.
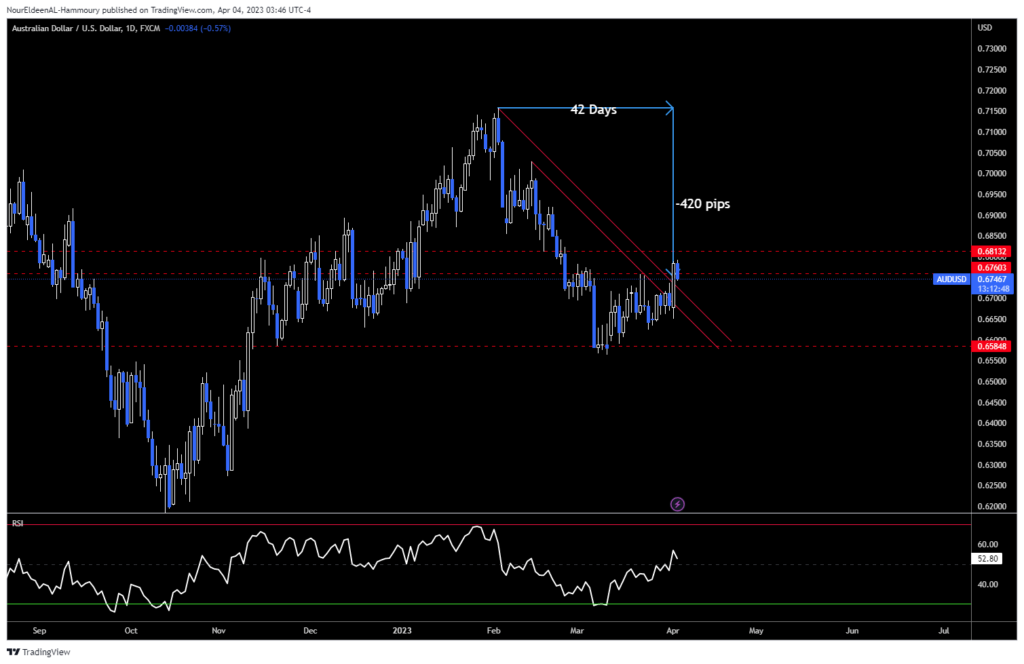
Yesterday, the AUDUSD price and time were equal. This means that the decline from the highest level of February 2nd to April 3rd was around 420 pips. This decline took exactly 42 days. This is when the time meets the price and vice versa. When time equals the price. The trend will change. Moreover, AUDUSD close well above the time line, which confirms the change in the current trend. A new trend is targeting 0.69 as an initial target.
The Stop Loss for this trade is at yesterday’s low, nearly 100 pips. If the theory is correct, the price should not return back to the previous session’s low. Therefore, we will keep an eye during the US session today to add more to this trade in order to being down our average price.
US Key Data
Yesterday, the ISM Manufacturing PMI showed a shocking print, shrinking to the lowest level since Covid-19, while the price paid also declined to the lowest level in two months, which shows that there is no inflation pressure, giving the Federal Reserve more room to reassess the data.
In the coming days, another set of economic figures will be released, including Jobs Opening, ISM Services PMI, ADP Non-Farm Employment Change, and the US Jobs Report on Friday. None of the data is expected to show solid growth, which could be another catalyst for the upcoming move in indices and currencies.
Keep an Eye on US 10 Yr Yield
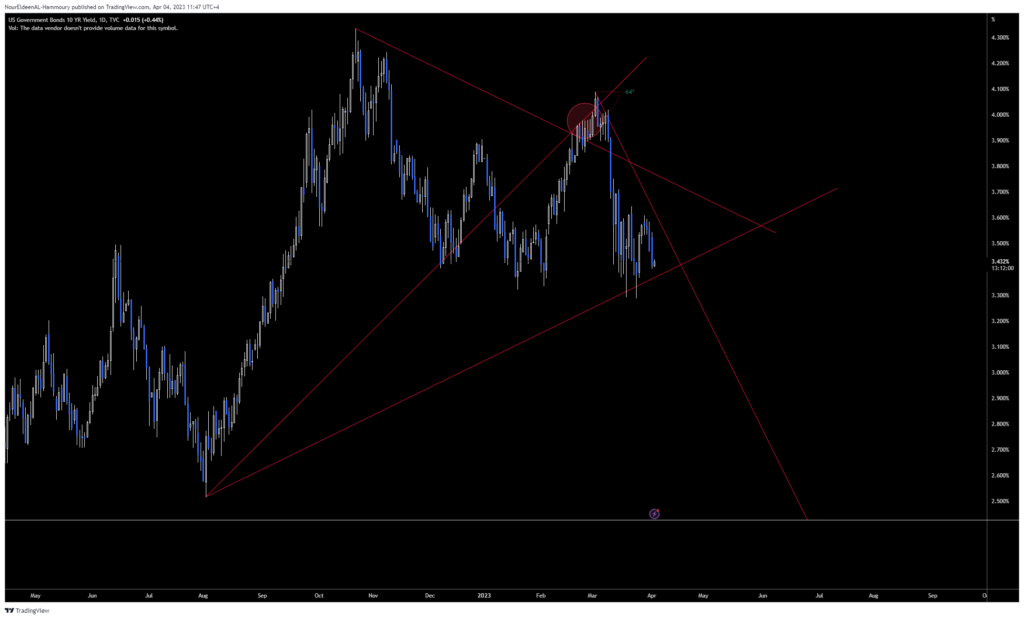
After the notable selloff over the past few weeks, the 10 Yr Yield traded within a tight range due to the time factor. Price was ahead of time after the sharp selloff within a short period of time. Therefore, a tight range was needed so that time can catch up, which is likely to occur in the coming days.
Keep an eye on 3.28% in the coming days, a breakthrough that support would clear the way for another selloff. Possibly toward 3.0% within the next few weeks, while the catalyst of such a move might come from the US Jobs Report. What does it mean for the S&P500? Another rally toward 4200 is highly possible.