Stocks Faces Key Test | More Good News For The Fed
The US stocks face a key test while it continues to gain more ground and get closer each day to new record highs. S&P500, DowJones, and Nasdaq are 5% away from that record. Are we going to see a new record high by the end of this earnings season? Yes, it’s possible.
However, this earnings season will be a key test for corporate profits, it will either confirm or deny whether AI plays a significant role in driving new revenue streams or not.
Despite that, I am not in a position to buy the indices yet, I would like to see a correction in the coming weeks, if it’s not through earnings, it might be from the Federal Reserve decision.
Good News For The Federal Reserve
Over the past two weeks, the economic releases confirmed that inflation and growth slowing down is faster than the Federal Reserve’s estimates. This includes the CPI, PPI, Jobs report, and the latest Retail Sales figures. Such data does not support the idea of two or three rate hikes before the end of the year. The market expectations have shifted significantly, the Fed Fund Futures are pricing in only one more rate hike in July. On the other hand, there is about a 30% probability that the first-rate cut might come as soon as December. This is what drove the market over the past two weeks, including indices, commodities, and the US Dollar.

Markets believe that the Fed will be able to raise rates only once, not two or three times. This is why we are seeing indices keeps pushing higher despite the Chinese disappointing GDP earlier this week, while the US Dollar keeps on drifting lower.
Current Positioning
Our current positioning remains the same including PayPal, NIO, BABA, and GBPAUD. You can check the status of these trades through the members’ area page under the Portfolio tab. All these trades are already posting decent profits. In the coming days, we will trim these positions to open the way for new positions.
The Next Positioning Plan
After the recent DXY breakdown, another short-term retracement is highly possible. Therefore, we will not chase the current move. Technical indicators are heavily oversold. Moreover, the Index has moved faster than time. This means that the dollar will stabilize with a possibility to reclaim its 100.0 towards 101.0 or 102.0 before the downside trend resumes. Therefore, we will continue our selective trading in stocks, currencies, and commodities until further notice.
DXY
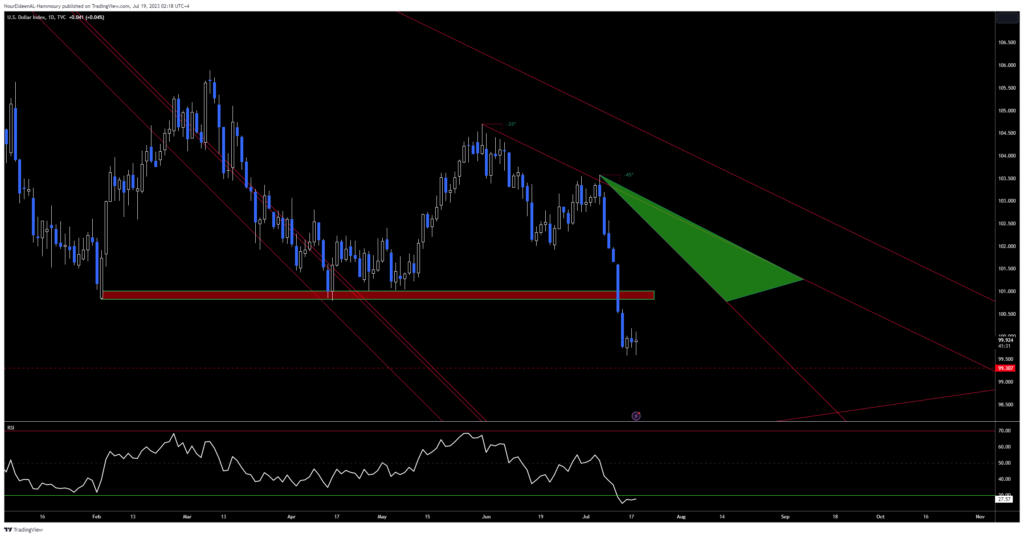
The US Dollar Index broke through the 100.0 key support area, with a weekly close below that key level, which deepened the bearish outlook. However, another upside retracement is highly possible. We will be on the sidelines for now, waiting for the upside retracement before rejoining the next move.
GBPUSD
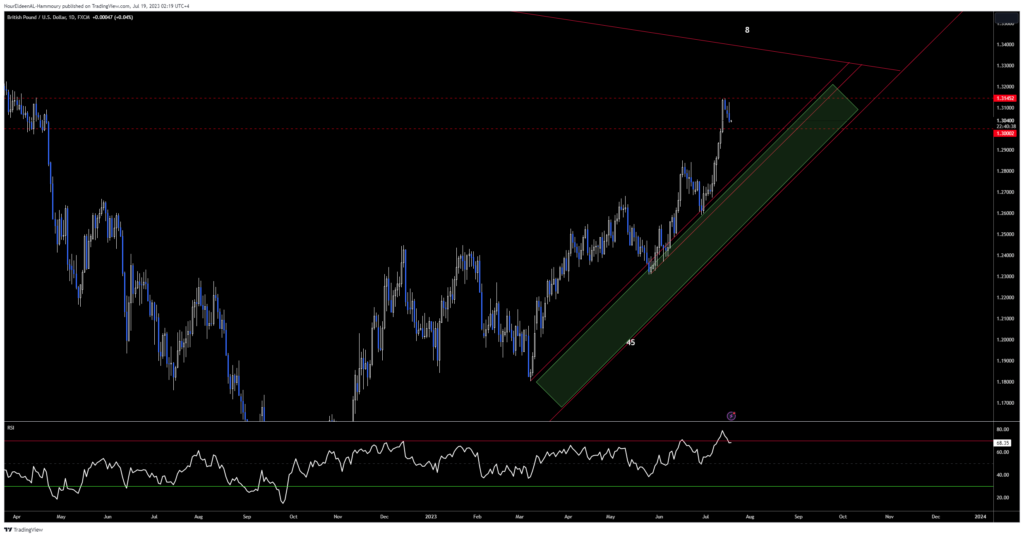
The pair continues to advance, riding 45 angle as shown on the chart. As long as the pair continues to trade above that angle. There is no reason for us to enter any short position. Therefore, any retracement to the downside is considered a buying opportunity.
EURUSD
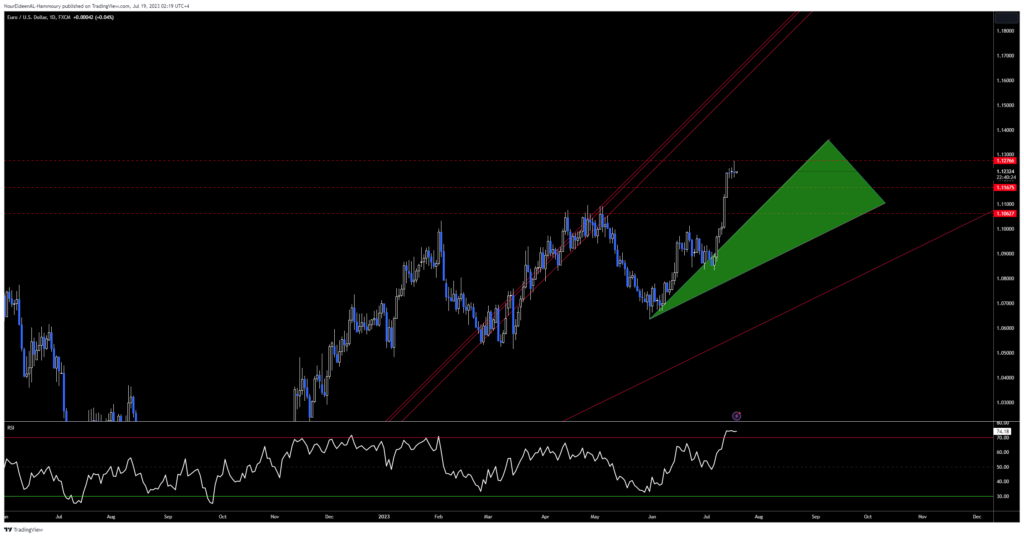
The pair managed to rally by +350 pips from our entry on the day of the US Jobs Report, breaking multiple key resistance areas. However, currently, the pair is heavily overbought, another short-term retracement is highly possible. The next downside retracement may continue towards 1.1060’s where we will be interested to join the next move.
USDJPY
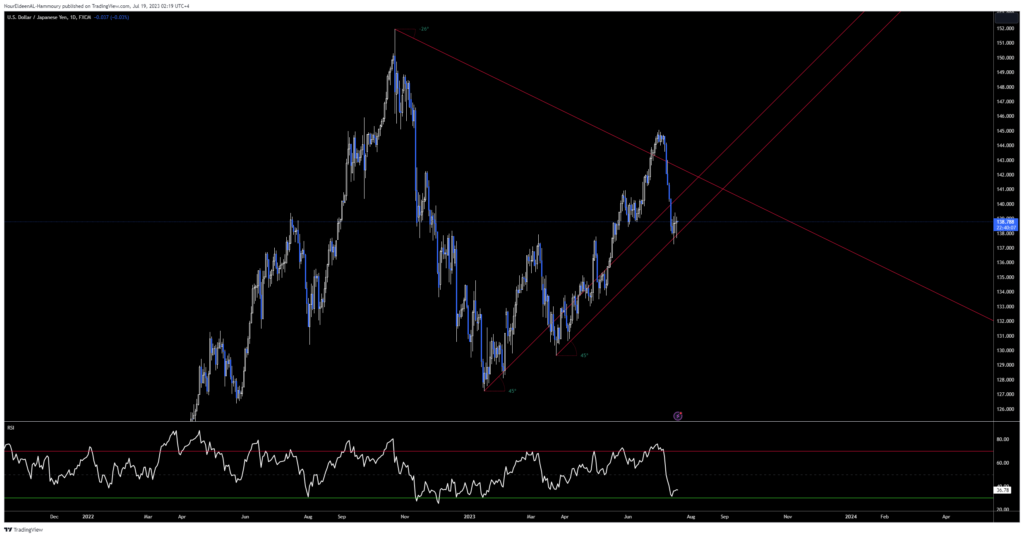
The pair declined to our desired target at 137 over the past few days, while the pair is now trading at the 45 key angle, while the pair is heavily oversold. A bounce is highly possible ahead of the Bank of Japan decision. We will start a gradual positioning over the next few days targeting 140.0 and 141.0.
Gold
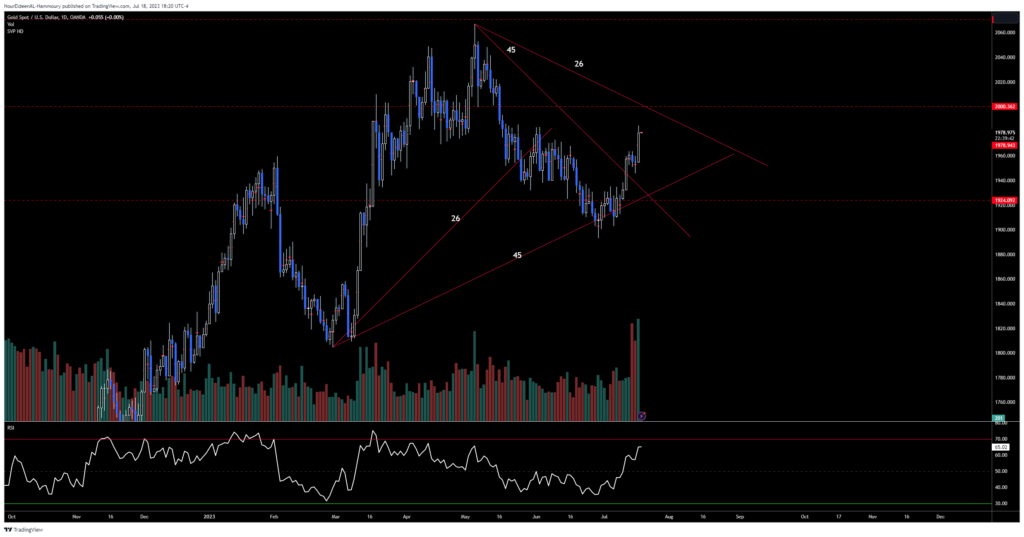
Gold finished its downside retracement at $1900 and we were unable to buy due to our high exposure at the time. Gold broke its 45 angle from the high of May 4th and continued to as high as $1985 today. In the meantime, the $2000 is considered a new target. However, its too late to join the current move. Therefore, we will be watching for the next downside retracement before joining the next leg higher.
Silver
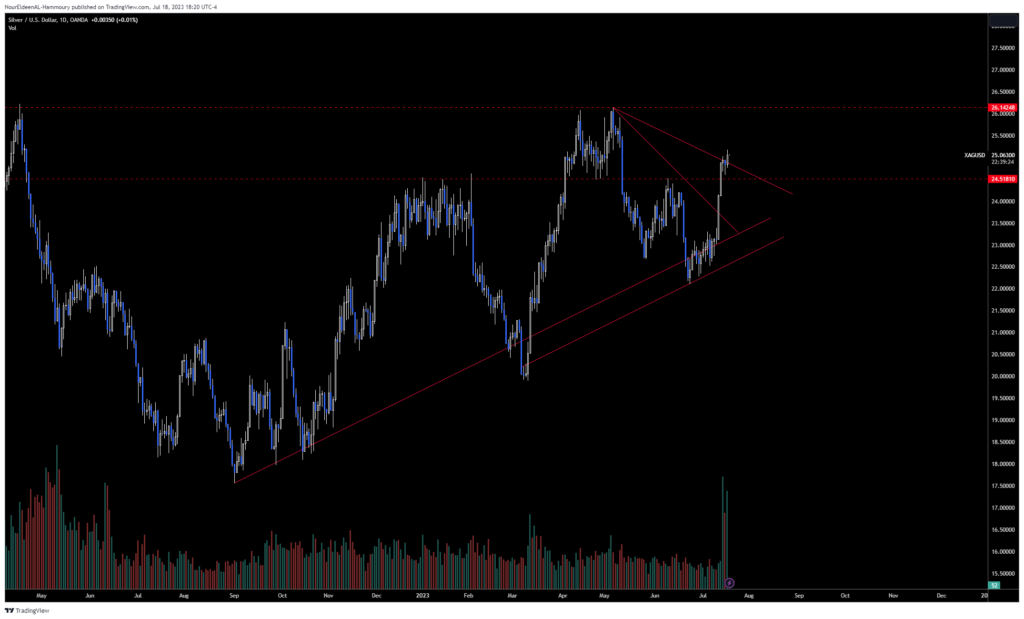
Silver also reclaimed multiple key resistance areas, reaching as high as $25.20 entering a new bull trend in the short term supported by weaker USD. However, another short-term retracement is highly possible towards $24.50 where we will be looking to join the next leg higher, targeting $26.15 for now


