الأسهم الاميركية امام اختبار حقيقي
الاسهم الاميركية امام اختبار حقيقي بينما استمرت المؤشرات الأميركية خلال الفترة الماضية في تسجيل المزيد من المكاسب وتقترب تدريجياً يوماً بعد يوم من الوصول الى اعلى مستوياتها التاريخية. كل المؤشرات الأميركية الرئيسية بما فيها مؤشر S&P500 ومؤشر DowJones ومؤشر Nasdaq100 بعيدة فقط حوالي 5% من اعلى مستوياتها في التاريخ. فهل من الممكن الوصول الى المستويات التاريخية خلال موسم النتائج الحالي؟ نعم هذا وارد جداً.
على الرغم من ذلك، موسم النتائج الحالي سيكون اختباراً كبيراً ومهماً للشركات بشكل عام، حيث ان هذا الموسم إما سيؤكد او سينفي مقدار أهمية الذكاء الصناعي للشركات بالفعل وهل كان للذكاء الصناعي تأثيراً ايجابياً وتستطيع الشركات ان تخلق منه مصادر دخل إضافية وكبيرة ام لا.
وعلى الرغم من استمرار الارتفاعات في المؤشرات الأميركية، لست في مكان لكي اشتري أي من هذه المؤشرات، اود ان أرى بعض التصحيح اولاً خلال الأسابيع القليلة المقبلة قبيل العودة للشراء في المؤشرات، إن لم تكن بسبب نتائج الشركات، فحركة التصحيح التالية قد تأتي بسبب قرار الفدرالي الأميركي المقبل.
اخبار جيدة للفدرالي الأميركي
خلال الأسبوعين الماضيين تحديداً أظهرت وأكدت المؤشرات الاقتصادية ان معدلات التضخم ومعدلات النمو تتباطأ بشكل واضح واسرع من توقعات الفدرالي نفسه، بما فيها مؤشرات أسعار المستهلكين ومؤشرات أسعار المنتجين وقطاع التوظيف فضلاً عن ارقام مبيعات التجزئة الأخيرة. هذه الأرقام لوحدها لا تعتبر كافية لكي تدعم فكرة الفدرالي بأن هناك ثلاث رفعات للفائدة إضافية حتى نهاية العام الحالي. بينما تغيرت توقعات الأسواق بشكل كبير خلال الفترة القصيرة الماضية، حيث ان العقود الآجلة لمعدلات الفائدة الأميركية أصبحت تسعر الان احتمالية رفعة وحيدة في يوليو. كما ان هناك احتمالية 30% بأن يأتي اول خفض للفائدة خلال اجتماع شهر ديسمبر المقبل. وهذا التغير في التوقعات هو السبب الرئيسي وراء الحركة الأخيرة في الأسواق بما فيها المؤشرات وأسعار السلع والدولار.
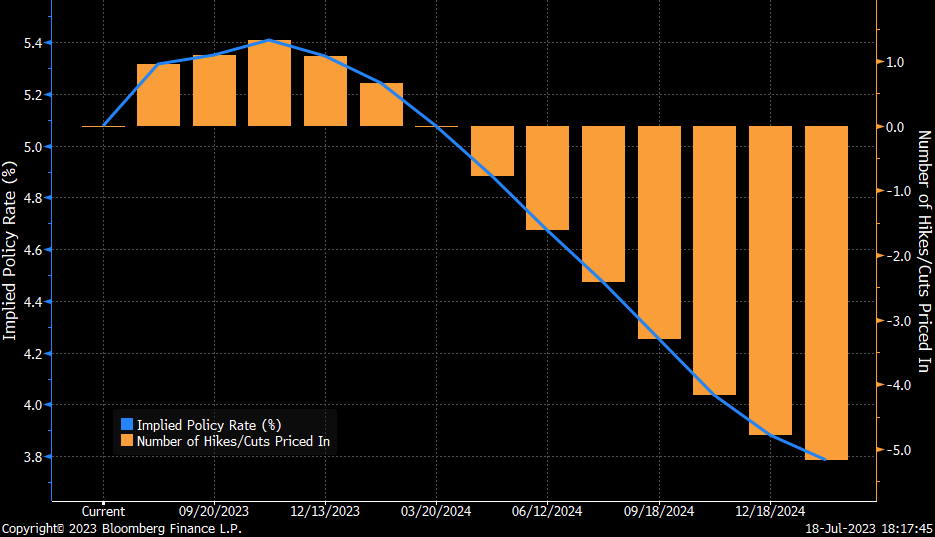
الأسواق تعتقد بأن الفدرالي لديه من المساحة بأن يرفع أسعار الفائدة مرة واحدة فقط، ولن يكون بمقدوره الربع مرتين او ثلاث مرات. ولهذا نشهد استمرارية الارتفاع في المؤشرات الأميركية على الرغم من خيبة الامل من ارقام النمو التي صدرت من الصين خلال اليوم الأول من تداولات هذا الأسبوع، بينما يستمر الدولار في التراجع.
التمركز الحالي
لازالت عملياتنا المتبقية على ما هي عليه دون تغيير، بما فيها اسهم شركة PayPal و NIO و BABA وأخيرا زوج الجنيه الإسترليني مقابل الدولار الأسترالي. يمكنكم متابعة هذه العمليات ضمن صفحة المشتركين تحت قسم محفظة التداول. جميع هذه العمليات لازالت تحقق مكاسب مجزية، وخلال الأيام القليلة المقبلة سنخفف من هذه العمليات لإتاحة المجال للتمركز من جديد في الأسواق قبيل الحركة المقبلة.
خطة التمركز المقبلة
بعد الحركة الأخيرة التي حصلت للمؤشر العام للدولار الأميركي، يحب ان نشهد حركة تصحيحية نحو الأعلى اولاً بغض النظر عن الأسباب. المؤشرات التقنية بشكل عام وصلت الى مرحلة تشبع عمليات البيع بشكل كبير. كما ان حركة الدولار خلال جلسة الأسبوع الماضي تحديداً كانت اسرع من الزمن، وهو ما يعني ان الدولار سيستقر خلال الفترة القصيرة المقبلة مع إمكانية العودة الى مستويات 100.0 نحو مستويات 101.0 وحتى مستويات 102.0 قبل استمرار الاتجاه العام المنخفض من جديد. ولهذا، سنستمر في التداول بشكل انتقائي في كل من الأسهم والعملات والسلع حتى اشعار آخر.
مؤشر الدولار
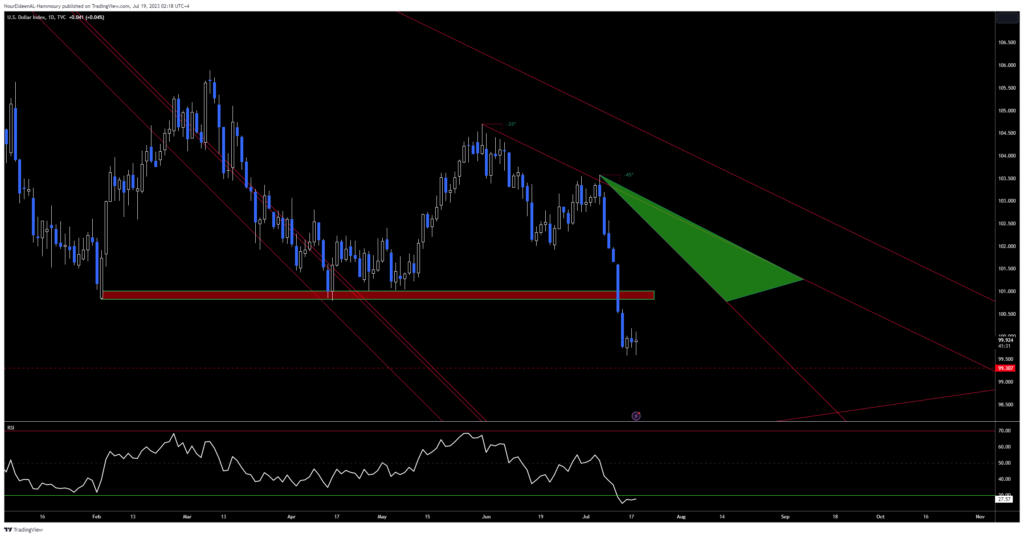
كسر المؤشر العام للدولار الأميركي مستويات الدعم النفسية عند مستويات 100.0 مع اغلاق الأسبوع الماضي دون تلك المستويات وهو ما يعمق من النظرة السلبية بشكل اكبر، لكن الدولار كما ذكر سابقاً يحتاج الى مرحلة تصحيح على المدى القصير اولاً قبيل الاستمرار بالتراجع، لذلك، سنتابع الحركة المقبلة قبل عودة التمركز من جديد عند وصول الدولار الى منطق التصحيح المذكورة أعلاه.
الجنيه الإسترليني
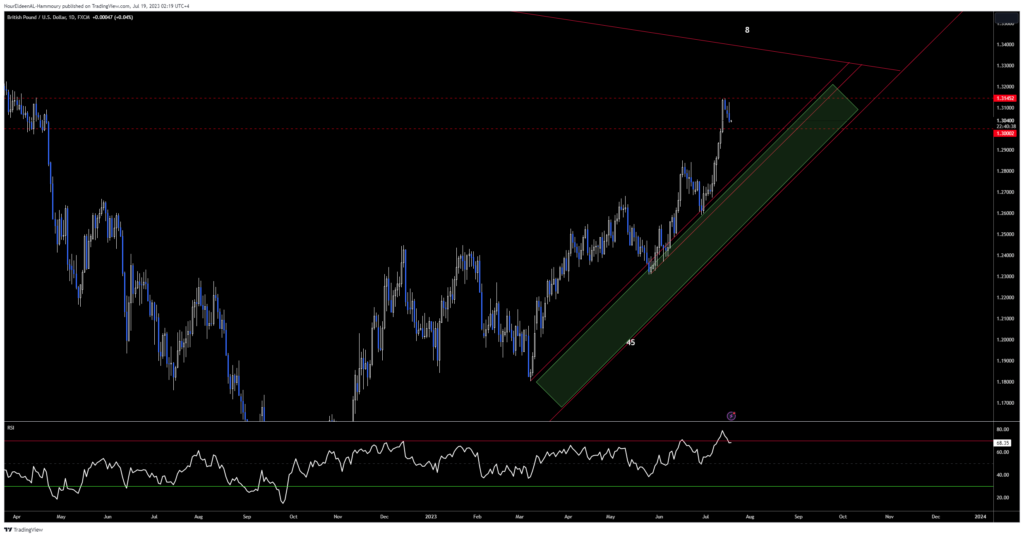
استمر الجنيه الإسترليني بالارتفاع مدعوماً بالتداول فوق الزاوية الرئيسية 45 على المستوى اليومي، وطالما ان الزوج يستمر في التداول فوق تلك الزاوية، فلا يوجد لدينا أي سبب لكي نقوم بأي عمليات بيع بعد. ولهذا، أي حركة تصحيحية نحو الأسفل لازالت تعتبر فرصة جديدة للشراء، وسننتظر الحركة التصحيحية اولاً قبيل التمركز من جديد.
اليورو
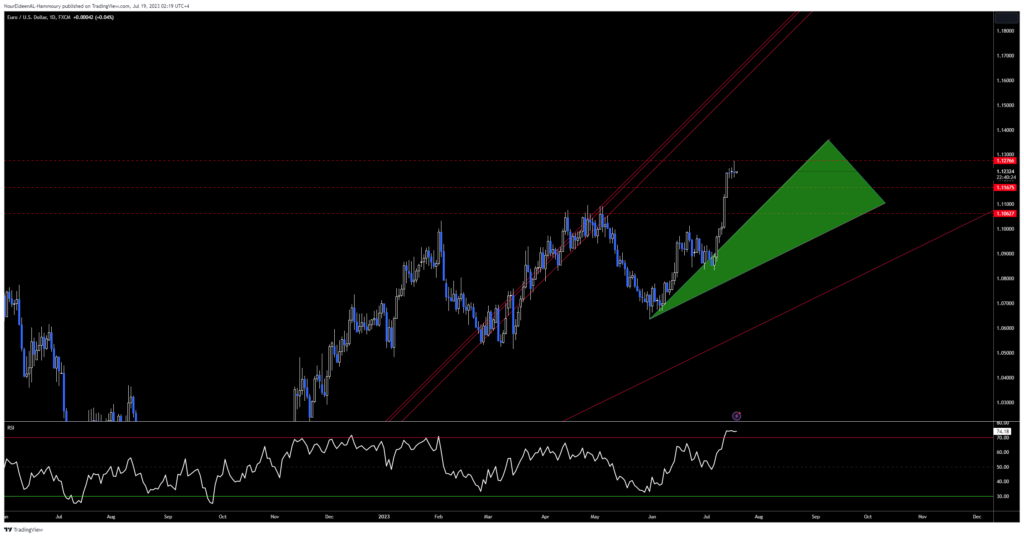
ارتفع اليورو بأكثر من 350 نقطة منذ اصدار توصية الشراء يوم الإعلان عن تقرير الوظائف الأميركي، ليخترق العديد من مستويات المقاومة الرئيسية. إلا ان الزوج وصل الى مرحلة تشبع عمليات الشراء بشكل كبير، ويحتاج ايضاً لمرحلة تصحيح قصيرة الاجل اولاً قبيل التمركز من جديد، حيث ان حركة التصحيح المقبلة من الممكن ان تصل الى مستويات 1.1060 اولاً.
الدولار مقابل الين
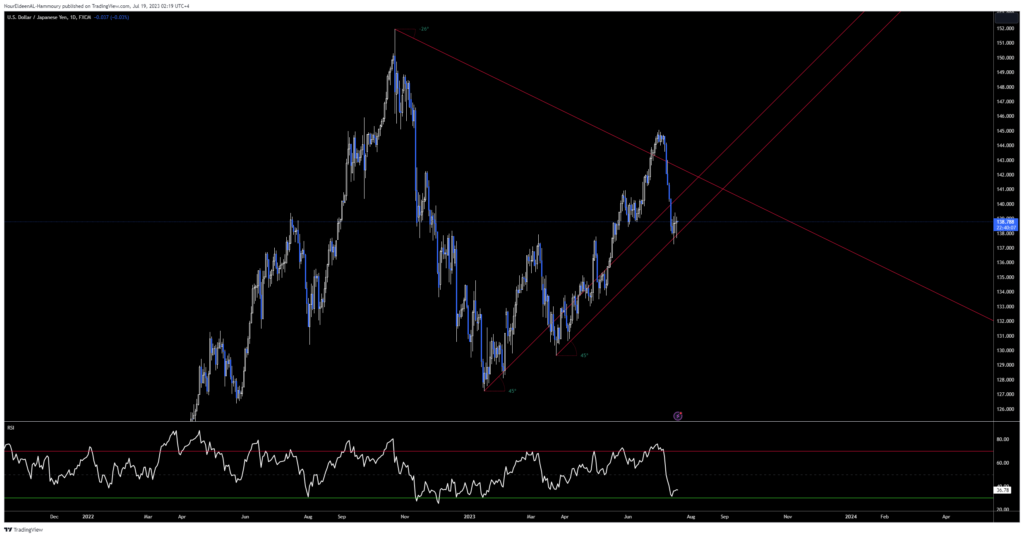
وصل زوج الدولار مقابل الين الى المستويات المستهدفة لدينا عند مستويات 137.0 خلال الأيام القليلة الماضية على الرغم من اننا اغلقنا عمليات البيع قبيل الوصول الى تلك المستويات. الزوج حالياً يتداول عند زاوية ال45 الرئيسية، ومن الممكن ان نشهد حركة تصحيحية نحو الأعلى من جديد مع اقتراب قرار البنك المركزي الياباني، ولذلك، من الممكن ان نقوم بالتمركز تدريجياً خلال الأيام القليلة المقبلة مع استهداف مستويات 140 وحتى مستويات 141.0.
الذهب
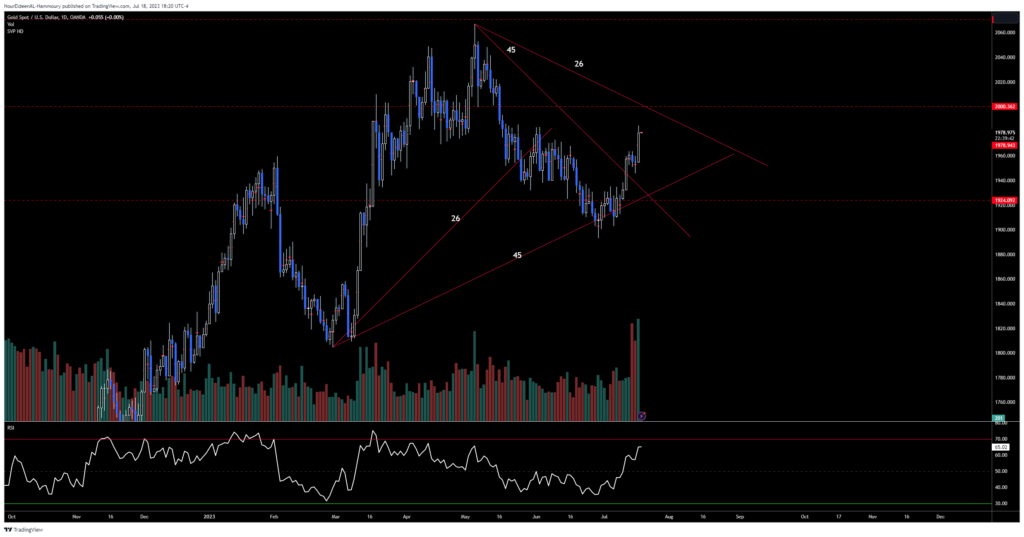
انهى الذهب مرحلة التصحيح نحو الأسفل خلال الفترة القصيرة الماضية عند مستويات 1900 دولار، لكننا لم نستطع ان نقوم بالشراء في ظل وجود العديد من العمليات لدينا في المحفظة في ذلك الوقت. الذهب اخترق الزاوية 45 الممتدة من اعلى مستويات يوم 4 مايو الماضي، واستمرت الارتفاعات نحو مستويات 1985 دولار اليوم. الهدف الحالي للحركة الحالية اصبح الان عند مستويات 2000 دولار، لكننا متأخرين جداً بالشراء، ولذلك، نفضل انتظار بعض التصحيح اولاً خلال الفترة المقبلة قبيل الحديث عن عمليات شراء جديدة بشكل تدريجي قبيل بداية الحركة التالية نحو الأعلى.
الفضة
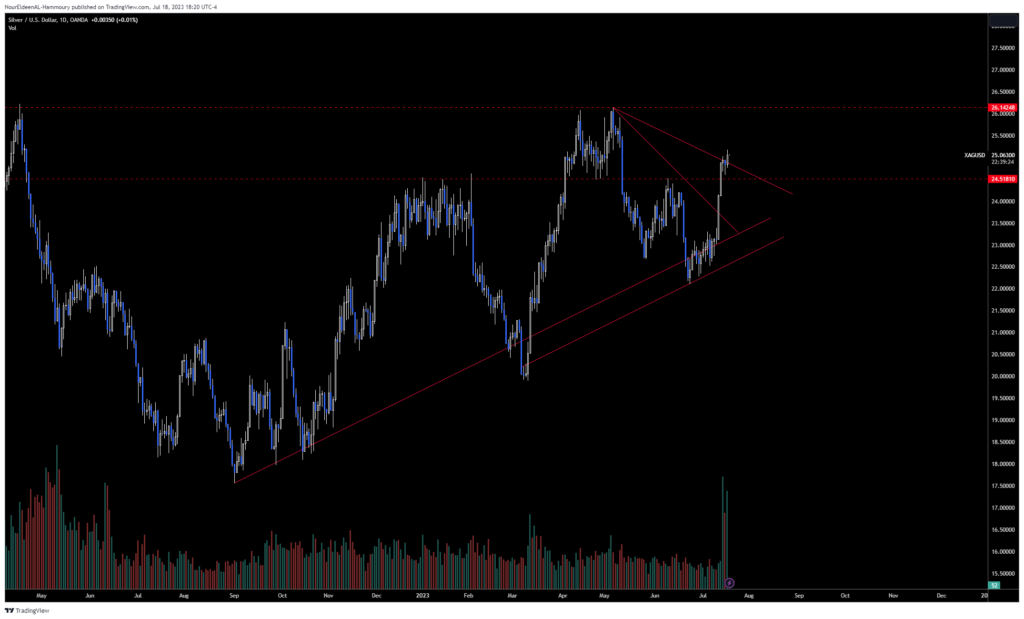
استطاعت أسعار الفضة ان تستعيد الكثير من مستويات المقاومة السابقة، لتصل الى مستويات 25.20 دولار لتدخل في مرحلة إيجابية جديدة على المدى القصير، وذلك بدعم من استمرار ضعف الدولار ايضاً وغم الحديث عن توقعات التضخم السلبية. لكن كما هو الحال في بقية السلع، الفضة تحتاج لبعض التصحيح اولاً قبيل الحديث عن عمليات شراء جديدة، بينما قد تصل مرحلة التصحيح الى مستويات 24.50 دولار اولاً قبيل ان نبدأ بالتمركز من جديد مع استهداف مستويات 26.15 دولار على الأقل.
Thank you for signing up, please read the following bullet points which explain how this paid service works and what you can expect.
Daily Market Report: It’s a daily report that covers the most important events or factors that we should be watching during the day/week/month. This daily report is not public and should not be shared on social media.
Live Trading Sessions: Depending on your Subscription, you will be able to register for any of the sessions, which will be scheduled on a monthly basis.
Portfolio: In this tab, you will be able to see the open positions with all the details, including the date of entry and the live performance.
Signals: Whenever there is a new signal, it will be published on that page, it will include the Symbol, Entry, Stop Loss, and Targets, and you will be able to track that signal through the portfolio tab.
Squawk Box: This is the audio streaming service where you will be able to hear all the news throughout the day.
News Feed: no need to refresh the page. The news will be listed as soon they arrive in real-time with sound notification.
1.0900